skip to main content
Environmental Issues

Whilst the council is focused on reducing its carbon footprint of all its activities we need to ask all the residents and businesses within Huntingdonshire to contribute toward achieving a net carbon zero Huntingdonshire by 2040.

Carbon footprints

Carbon footprints are a way of accounting for the total greenhouse gases (GHG) caused directly and indirectly by a person, organisation, event or product.

The most common GHG is carbon dioxide (CO2), which makes up 81% of UK GHGs.

Other GHGs such as methane (CH4) or nitrous oxide (N2O) are measured in ‘carbon dioxide equivalent’ (CO2e), which takes into account the diverse effects different gases have on the environment. 
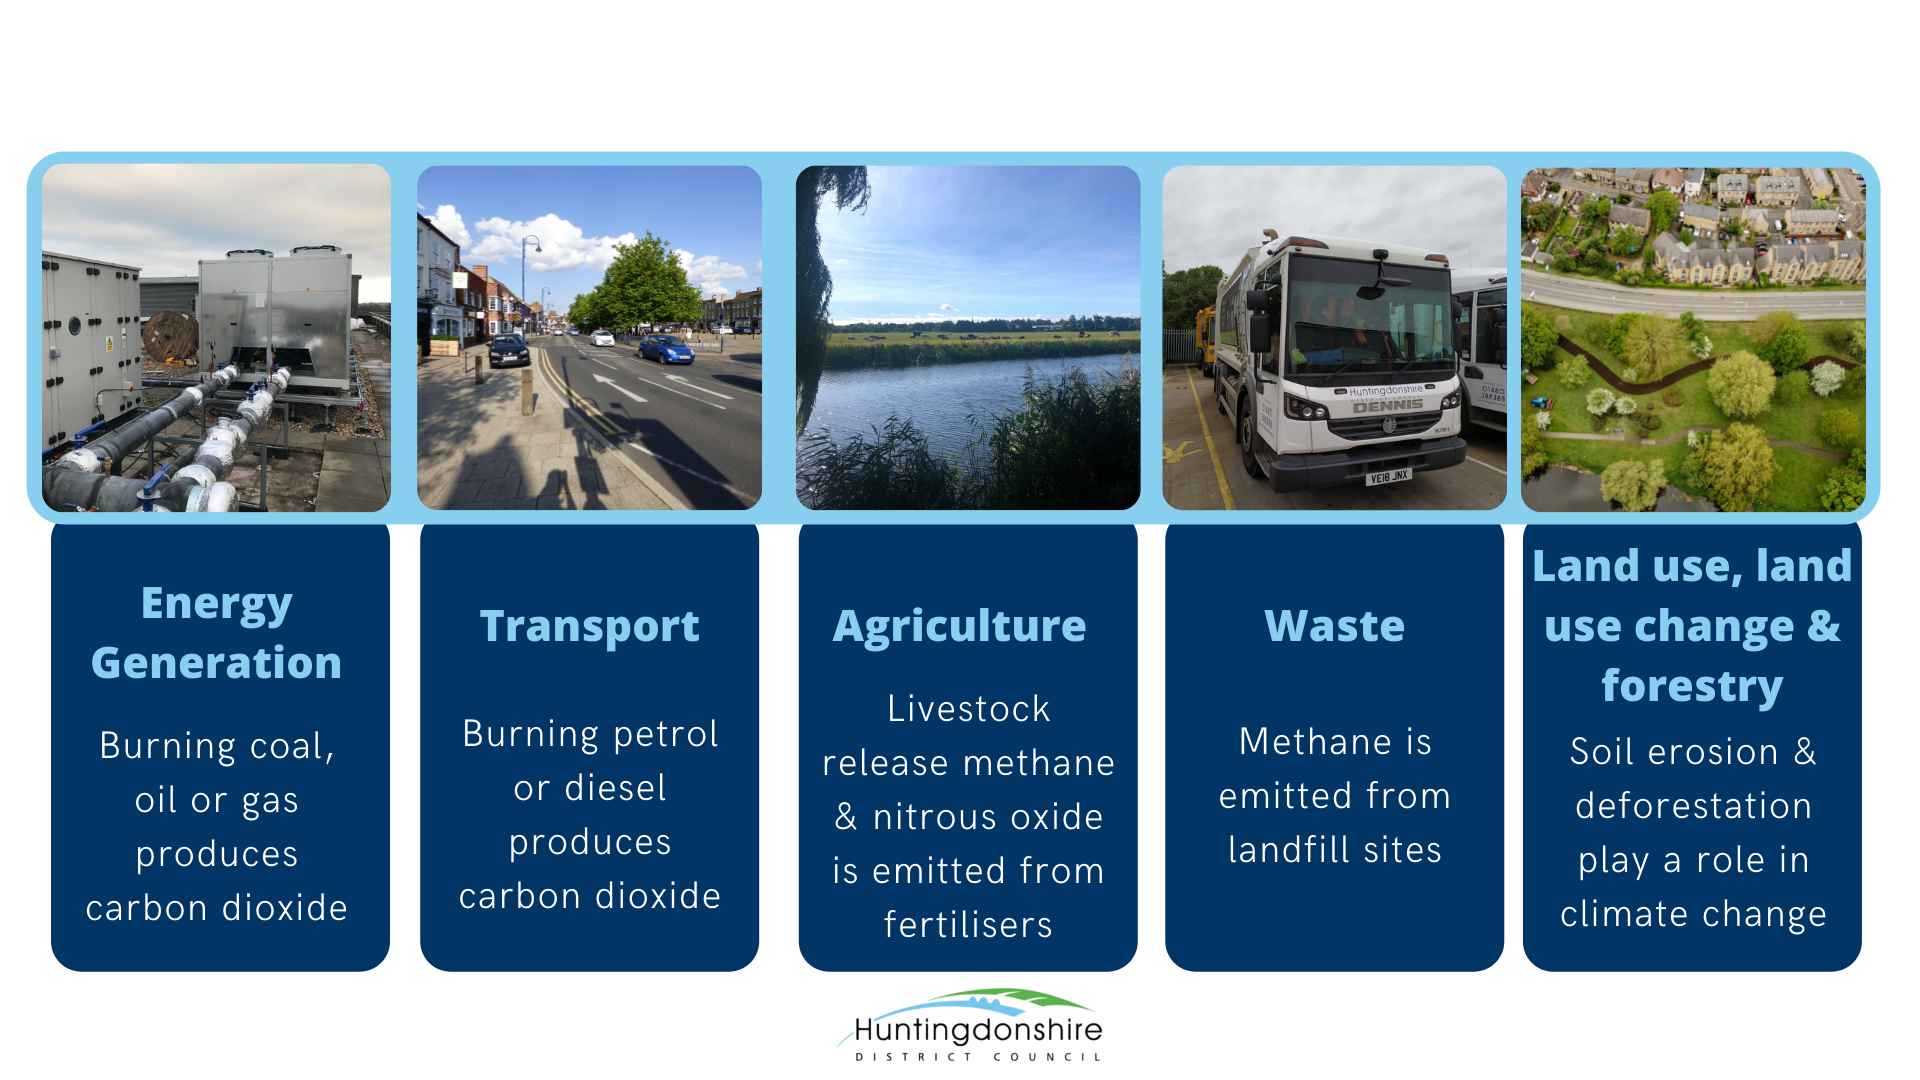
A wide range of activities produce GHGs. For carbon foot printing purposes these tend to be broken down into 5 sectors:

The challenge is complex with things we can do now, and some things which will be easier to do in the future. The Department for Business, Energy and Industrial Strategy records information on C02 emissions.

Based on this information, the chart below highlights the dominance of emissions from road transport reflecting the nature of our district followed by emissions associated with farming land use. But domestic household emissions matter as well - we can all do our bit.

Huntingdonshire co2 emissions by sector per capita from 2005-2019.  Road Transport. 2005 4.31 tonnes co2 per person, 2019 3.87 tonnes co2 per person  LULUCF. 2005 2.49 tonnes co2 per person, 2019 2.12 tonnes co2 per person  Domestic. 2005 2.47 tonnes co2 per person, 2019 1.41 tonnes co2 per person  Industry. 2005 2.17 tonnes co2 per person, 2019 0.88 tonnes co2 per person  Commercial. 2005 0.92 tonnes of co2 per person, 2019 0.31 tonnes of co2 per person  Public sector. 2005 0.30 tonnes of co2 per person, 2019 0.12 tonnes of co2 per person  Agriculture. 2005 0.15 tonnes of co2 per person, 2019 0.15 tonnes of co2 per person  Other Transport. 2005 0.07 tonnes of co2 per person, 2019 0.1 tonnes of co2 per person  Diesel Railways. 2005 0.01 tonnes of co2 per person, 2019 0.02 tonnes of co2 per person

Pie Chart showing 2005 Huntingdonshire emissions by sector by kilotons of co2.  Agriculture 25.02 kilotons 1.19% Commercial 150.39 kilotons 7.16% Diesel Railways 2.37 kilotons 0.11% Domestic 401.36 kilotons 19.11% Industry 353.62 kilotons 16.84% LULUCF 405.86 kilotons 19.33% Other Transport 11.75 kilotons 0.56% Public Sector 48.59 kilotons 2.31% Road Transport 701.17 kilotons 33.39%

Pie Chart showing 2019 Huntingdonshire emissions by sector by kilotons of co2.  Agriculture 27.39 kilotons 1.72% Commercial 55.86 kilotons 3.5% Diesel Railways 2.7 kilotons 0.17% Domestic 251.27 kilotons 15.73% Industry 156.17 kilotons 9.78% LULUCF 377.72 kilotons 23.65% Other Transport 17.26 kilotons 1.08% Public Sector 20.54 kilotons 1.29% Road Transport 688.08 kilotons 43.09%

Picture showing the changes in co2 emissions top 10 subsectors  Cropland 2005 426.48 kilotons, 2019 403.84 kilotons  A roads 2005 421.36 kilotons, 2019 383.81 kilotons  Industry Electricity 2005 210.79 kilotons, 2019 61.55 kilotons  Domestic Gas 2005 186.3 kilotons,2019 160.03 kilotons  Domestic Electricity 2005 179.96 kilotons, 2019 63.24 kilotons  Motorways 2005 151.06 kilotons, 2019 160.81 kilotons  Commercial Electricity 2005 130.85 kilotons, 2019 38.97 kilotons  Minor Roads 2005 128.74 kilotons, 2019 143.41 kilotons  Industry fuels 2005 91.29 kilotons, 2019 77.62 kilotons  Industry Gas 2005 50.89 kilotons, 2019 16.27 kilotons

Graph showing the subsectors that saw the largest percentage gain in co2 emissions in the period 2005-2019  Grasslands 256.69% rise in co2 Other Transport 46.99% rise in co2 Large Industrial Installations 16.23% rise in co2 Diesel Railways 13.89% rise in co2 Minor Roads 11.43% rise in co2

Graph showing the subsectors that have seen the biggest fall in co2 emissions from 2005 to 2019  Public Sector Other Fuels 83.66% fall Public Sector Electricity 72.43% fall Industry Electricity 70.8% fall Commercial electricity 70.225 fall Industry Gas 68.04% fall